Project: Attendance Monitoring System with Fraud Prevention Technique
Short Description of the Project
In this project, an Attendance Monitoring System (AMS) is designed for educational institutions. The novel aspect of this project is to integrate a password-protected attendance counting module with the system. The module can effectively limit the fraudulent activities in attendance monitoring process. Besides that, some constraints are proposed to increase the security of the AMS. Based on the constraints a new system is designed to maintain the attendance data and the user information. The aim of this project is to design an effective AMS using the Radio Frequency Identification (RFID) technology to prevent fraudulence. Besides, the attention is given to the usability and the efficiency of the system.
Machine: Intel(R) Core(TM) i5-2430M machine with 2.40 GHz processor and 8.00 GB RAM
Operating System: Windows 10 (64 bit)
IDE: Microsoft Visual Studio 2015, Arduino IDE 1.6.8
Database: Microsoft SQL Server Management Studio 2014
Microcontroller board: Arduino Uno
Methodology
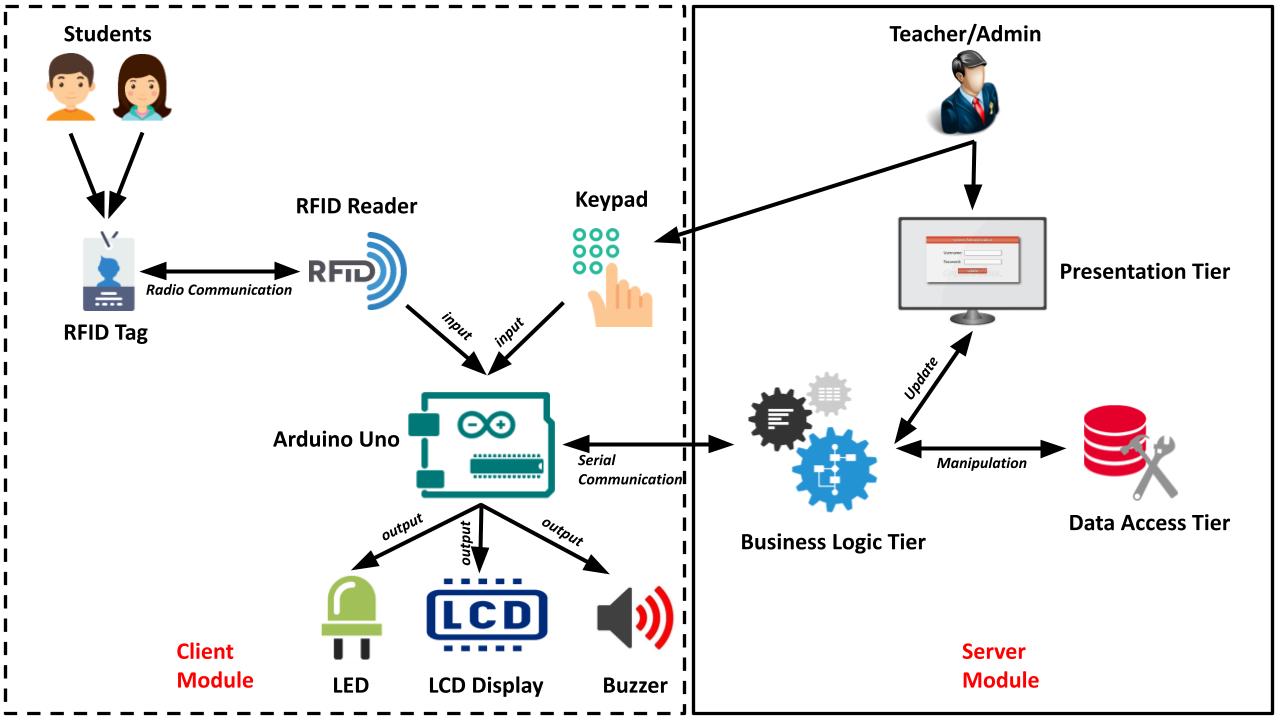
Our proposed AMS is divided into two distinct parts. One is the client module and another one is the server module. The system architecture of our system is shown in Figure 1.
Figure 1: The system architecture of our proposed AMS. The black dashed box indicates the client module and the black solid box indicates the server module of the system.
The Client Module
The client module is used by both the students and the teachers. There is a keypad integrated with it. When a lecture class is started, the teacher provides a secret password to the module using the keypad. Only after the password activation, the students can give attendance using their ID cards. The teacher can stop attendance counting whenever s/he wants by providing the password again. Therefore, students are restricted to give attendance only on the lecture time in front of the teacher. The password is set or updated by the course teacher only. An admin panel is provided on the server PC for this purpose. The ID card issued for each student works as an RFID tag. Whenever the ID card is brought to the RFID reader’s range, the reader reads the unique tag id of the ID card. Then the tag id is sent to the Arduino, which is the micro-controller unit of our system. The Arduino further sends the tag id to the server pc. The server pc has an application that reads the tag id using the serial communication port. The application counts attendance and sends a notification back to the Arduino. The Arduino displays the response on the LCD. In case of successful response, the green LED is blinked as well as the buzzer is beeped. The whole client module of the proposed system is independently operated by the Arduino board. It is programmed by following the Algorithm 1. Firstly, the Arduino, RFID and the LCD modules are initialized. Then a loop continuously looks for a key-press or the detection of an ID card. Whenever a key-press is detected it means that a user is trying to input a password. The program then reads the whole password and sends it to the server. Then it waits to get a feedback response from the server module. When the server sends a response, the client program shows the feedback in the LCD. On the other hand, if an RFID card is detected the program reads the tag ID from the ID card. The tag ID is a 5-byte number which is sent to the server module. Then the program waits for the response from the server. Finally, the response is displayed in the LCD.
The Server Module
The server module of our proposed system consists of an application and a database. The application is designed by following the N Tier Architecture. The tiers are the data access tier, presentation tier, and the business logic tier. The data access tier contains the database initialization functions. The presentation tier contains the Graphical User Interface (GUI) which is accessed by the teachers only. The business logic tier contains the logical functions and the database queries. It also controls the data flow of the program. In our system, the presentation tier cannot access the data access tier directly. Only the business logic tier has the permission to access both the presentation tier and the data access tier and vice-versa. The directions of the data flow among the presentation tier, business logic tier and the data access tier are shown in Figure 1. We have shown how client module sends password and tag ID to the server module using Algorithm 1 in section 3.1. To receive these passwords and tag IDs properly, the server runs a synchronous program. The program is written by following the Algorithm 2. The program always listens the serial port of the server pc and whenever any data is available in the port it receives the data using a DataReceivedHandler function. Now, this data can be a password or a tag ID. If the data is a password it goes through a validation process. If the password is valid it is used as a search key to find the corresponding course in the database. It is better to mention that every course has a specific password, set by the course teachers at the beginning of the semester. However, if there is no lecture class being conducted at that point in time, a new attendance counting session is started for the corresponding course. Otherwise, if the corresponding course is already running, the system stops counting the attendance for it. On the other hand, if the data is a tag ID the system takes attendance for the corresponding student between the starting and stopping interval of the running course.
Implementation
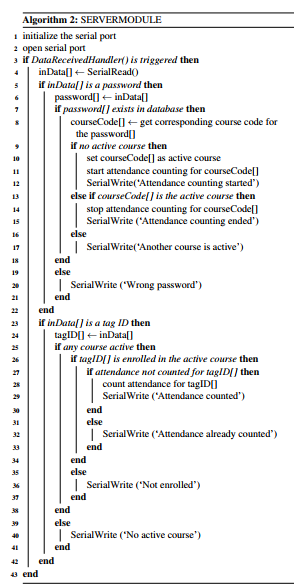
The system was successfully implemented in a real-world environment. The teachers could give the password to the client module and start or stop the attendance counting. The students could give their attendance using RFID tag and the attendances were counted in the server module, shown in Fig. 4(a). The features of the server application were accessed by the teachers only. They could use their username and password to log in the application. shown in Fig. 4(b). Fig. 4(c) shows the features of the application. The feature description of the application is given below:
6.1.1. Add Student
The admin can add information about new students using this option. The information can be updated from this option. It also prohibits any duplicate entry of student information.
6.1.2. Assign Course
Using this option an admin can assign different courses to a specific student. The admin can see all enrolled courses of a given student ID as well as delete the courses.
6.1.3. Show Students It is a very useful option to see the information of all students existing in the system database. The student information can be filtered using student ID and the information can be printed from here.
6.1.5. Attendance The attendance record can be seen from this option for a specific course. From this record, an attendance report can be generated and printed for hardcopy documentation.
6.1.6. Add Course As courses are variable for a given department, this option is used to add course names and course IDs to the system database. Most importantly, it is used to set or edit course password which is vital for attendance counting. Courses can be dropped from this window too.
Figure 4: The forms of the server application. The main form of the application is shown in (a) where the attendance of a day is counted and displayed. The form is also used to start and stop the server application. An admin can access the applications by using a login form, shown in (b). After login s/he can use all of the features of the applications shown in (c).
Usability Testing Result
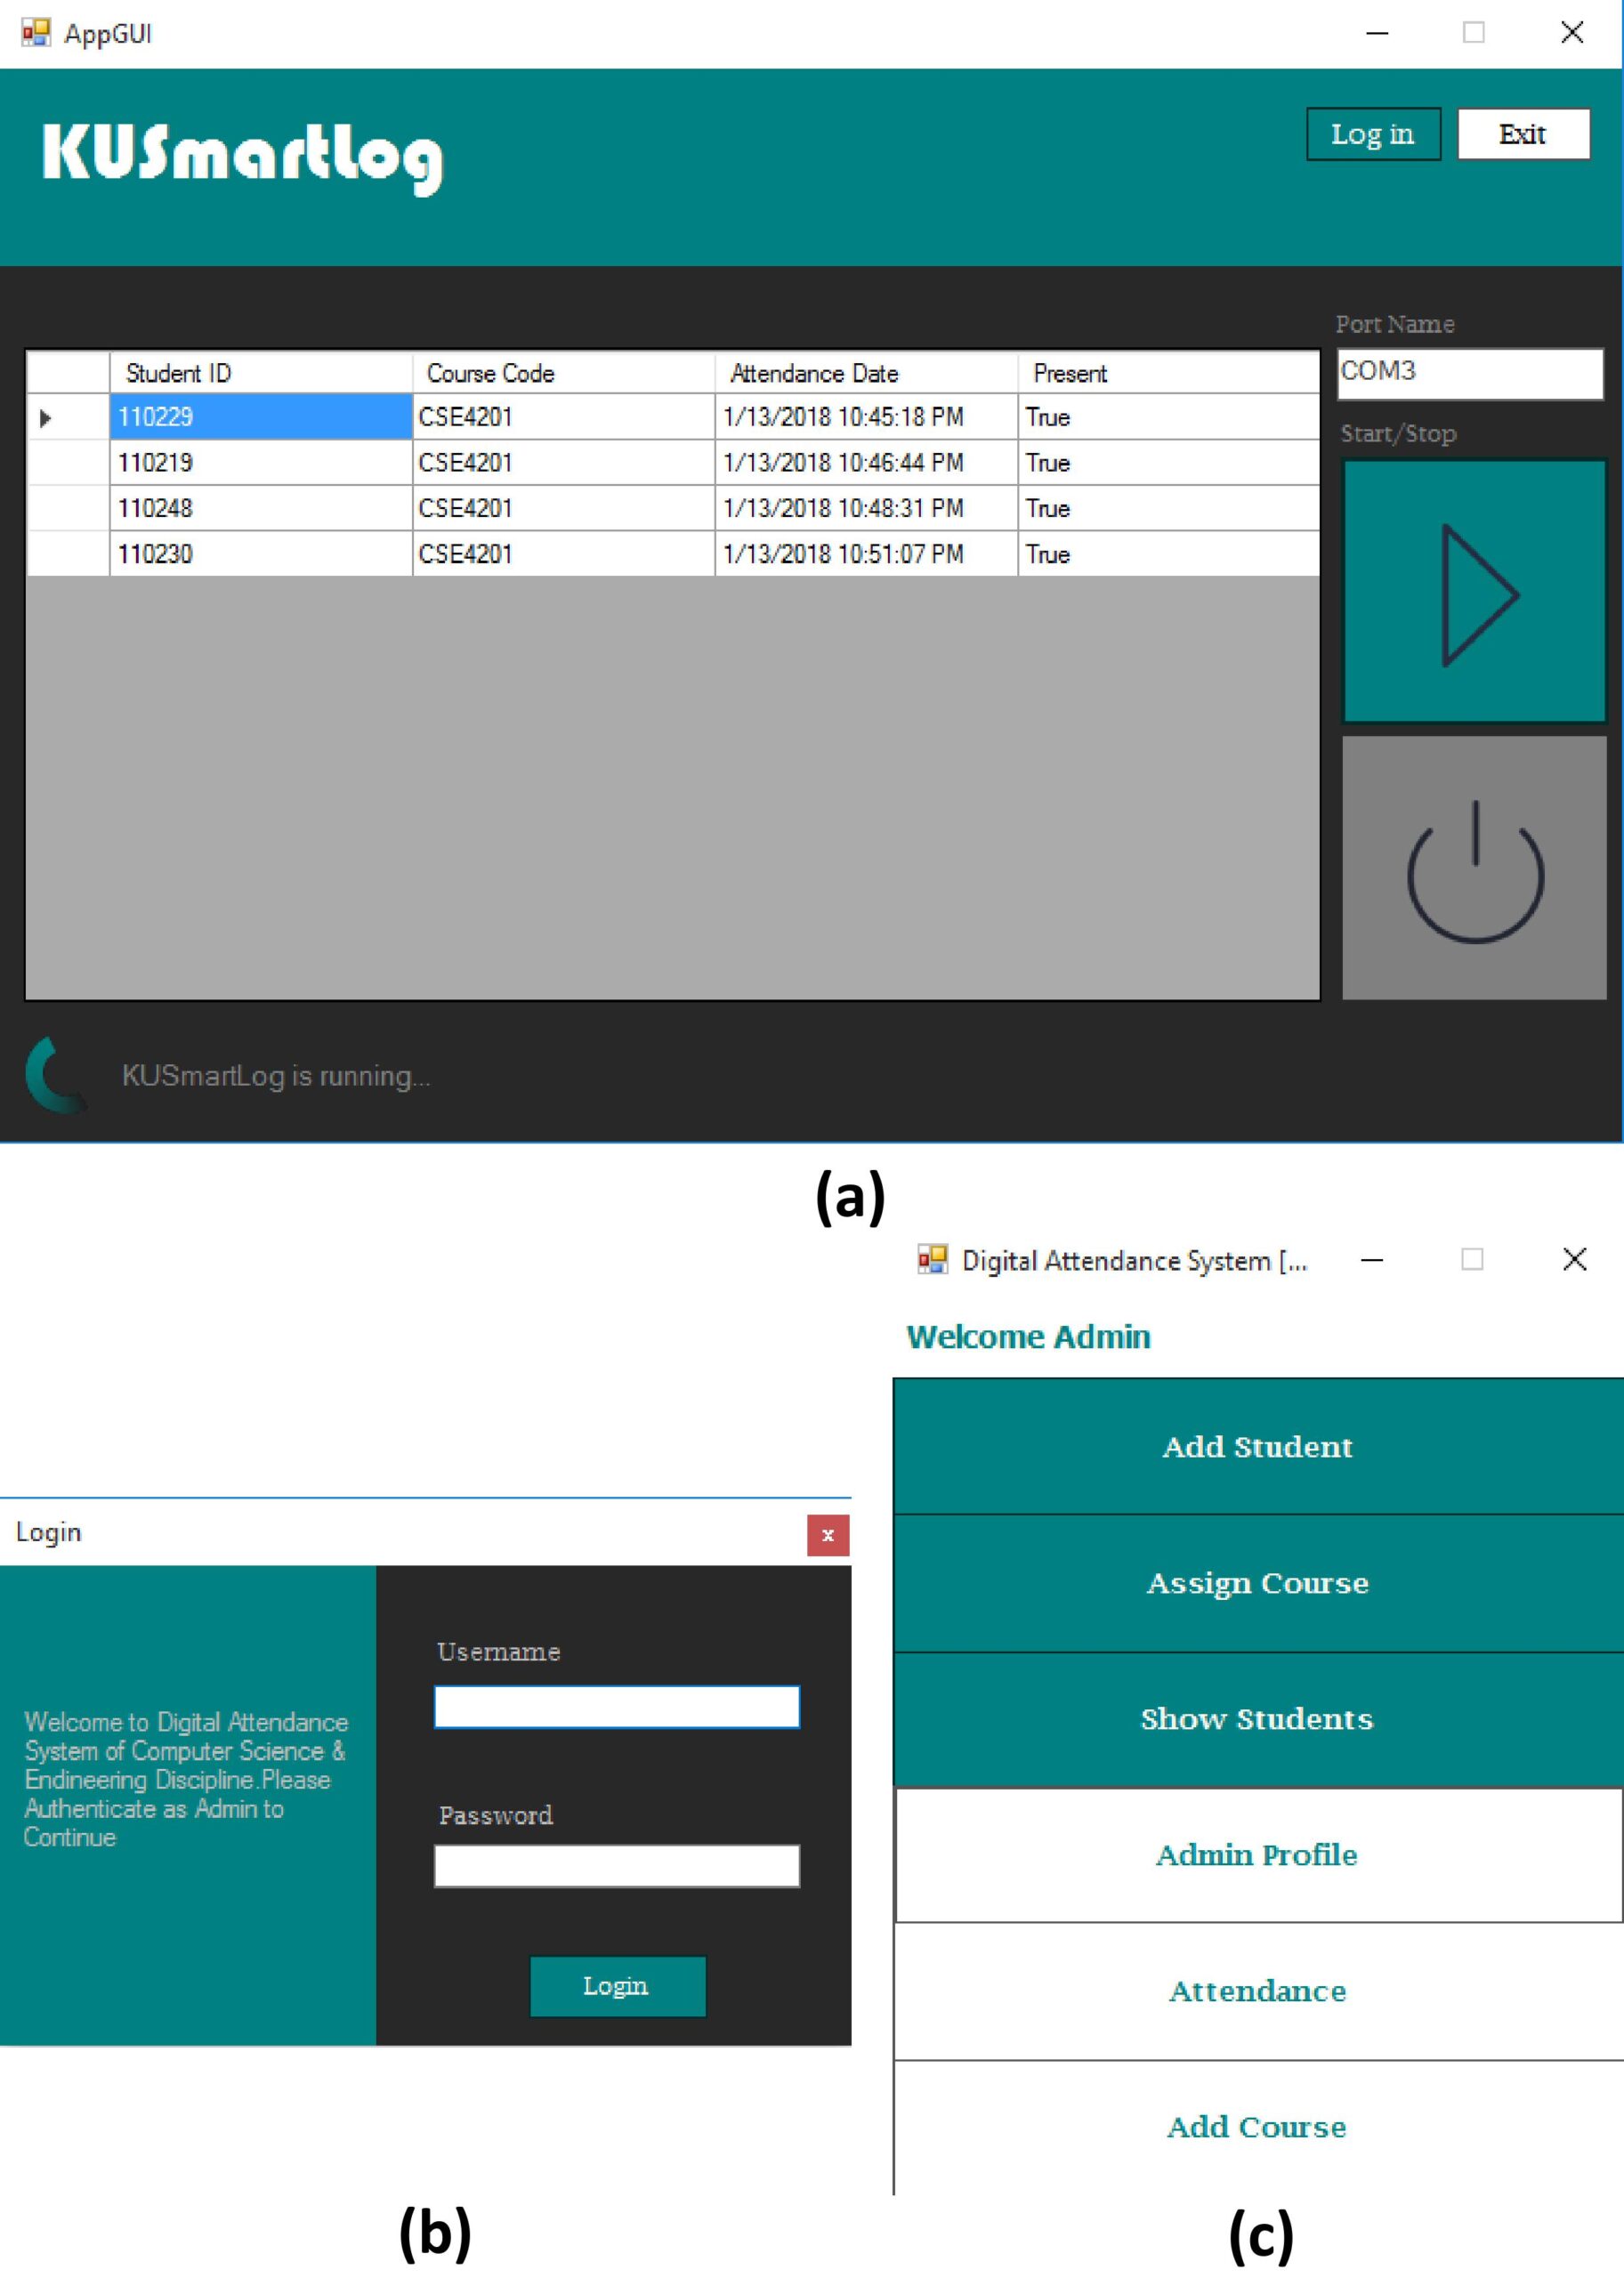
The SUS score has a range of 0 to 100. According to our test results, the best and worst SUS scores found for our system are 82.5 and 60 respectively. The average SUS score for all of the responses for our system is 71.92 and the standard deviation among the SUS scores is 6.21. A survey is performed, where an identical adjective rating scale is defined with respect to the SUS scores. According to the reference, any system having SUS score in between 71.4 and 85.5 and having standard deviation below 11.6 is considered as a “good” system. As the average SUS score of our system is 71.92 and the standard deviation among the SUS scores is 6.21, we can say that the adjective rating for our system is “good”.
Figure 6: Mean SUS score ratings corresponding to the seven adjective ratings.
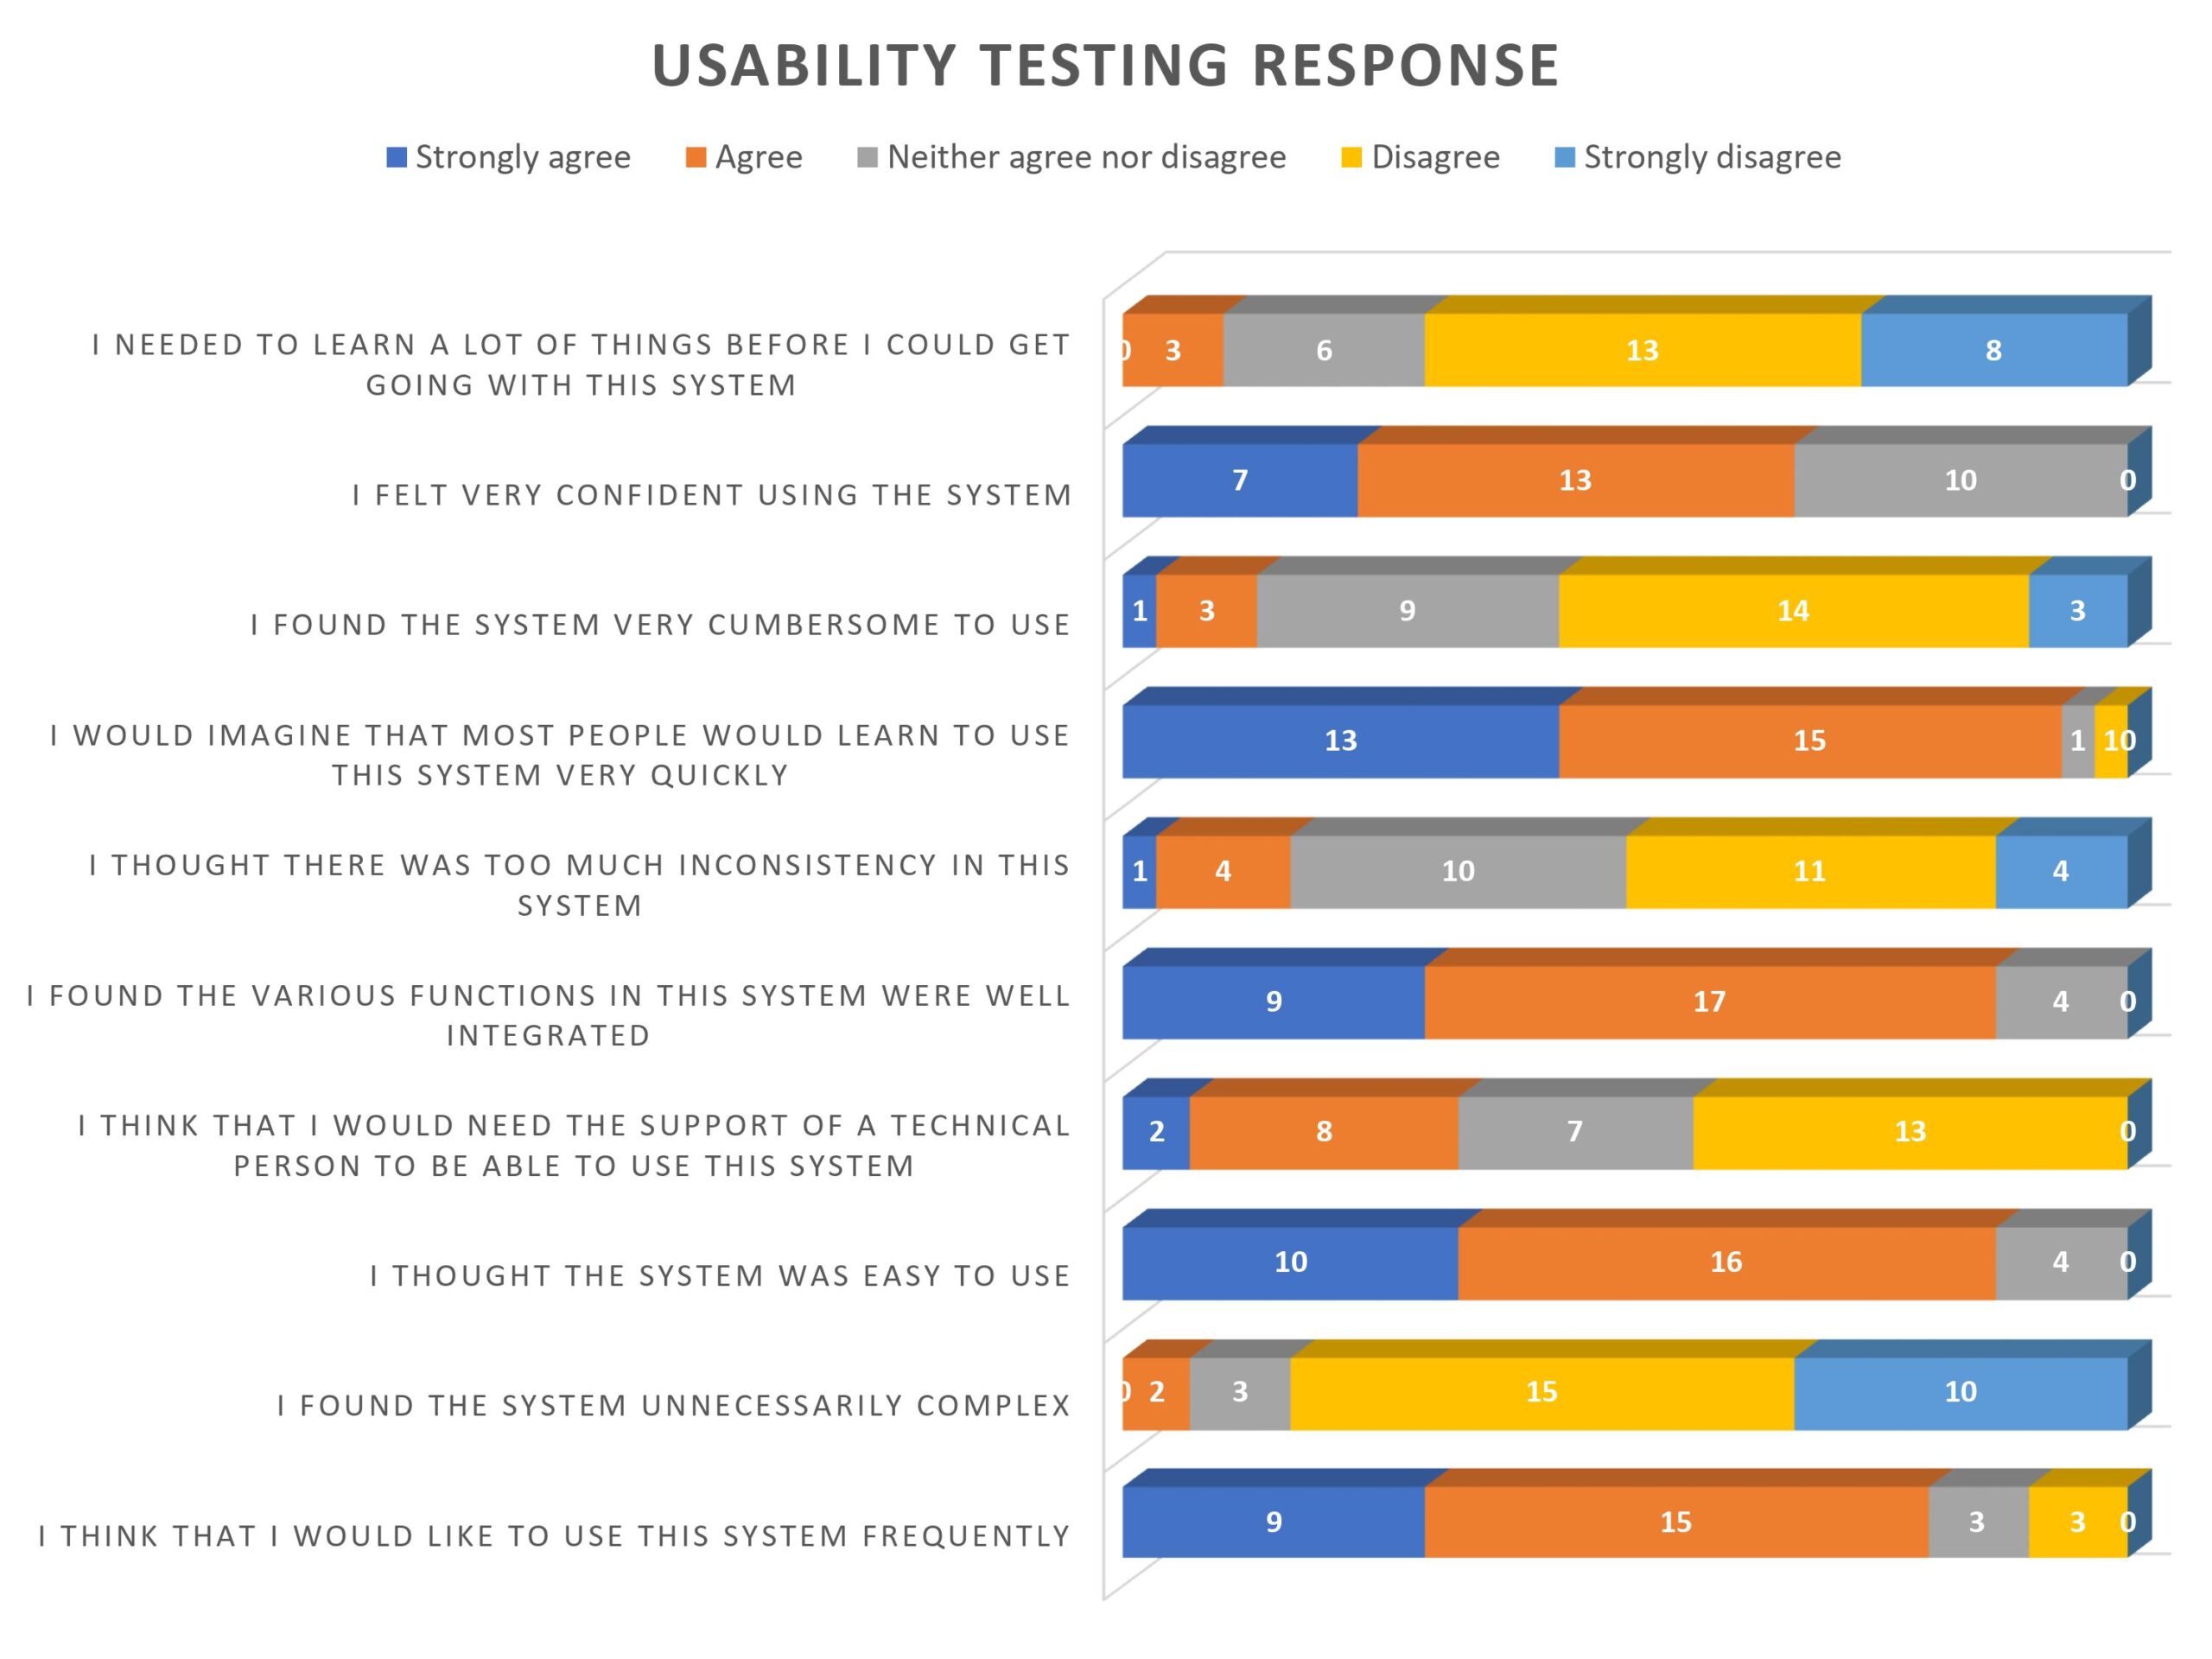
Figure 5: Usability testing response of our proposed system. For each of the questions, students could give a score 1 for strongly agree, 2 for agree, 3 for neither agree nor disagree, 4 for disagree and 5 for strongly disagree. The bars in the figure shows how many students gave what score for each question.
Performance Testing Result
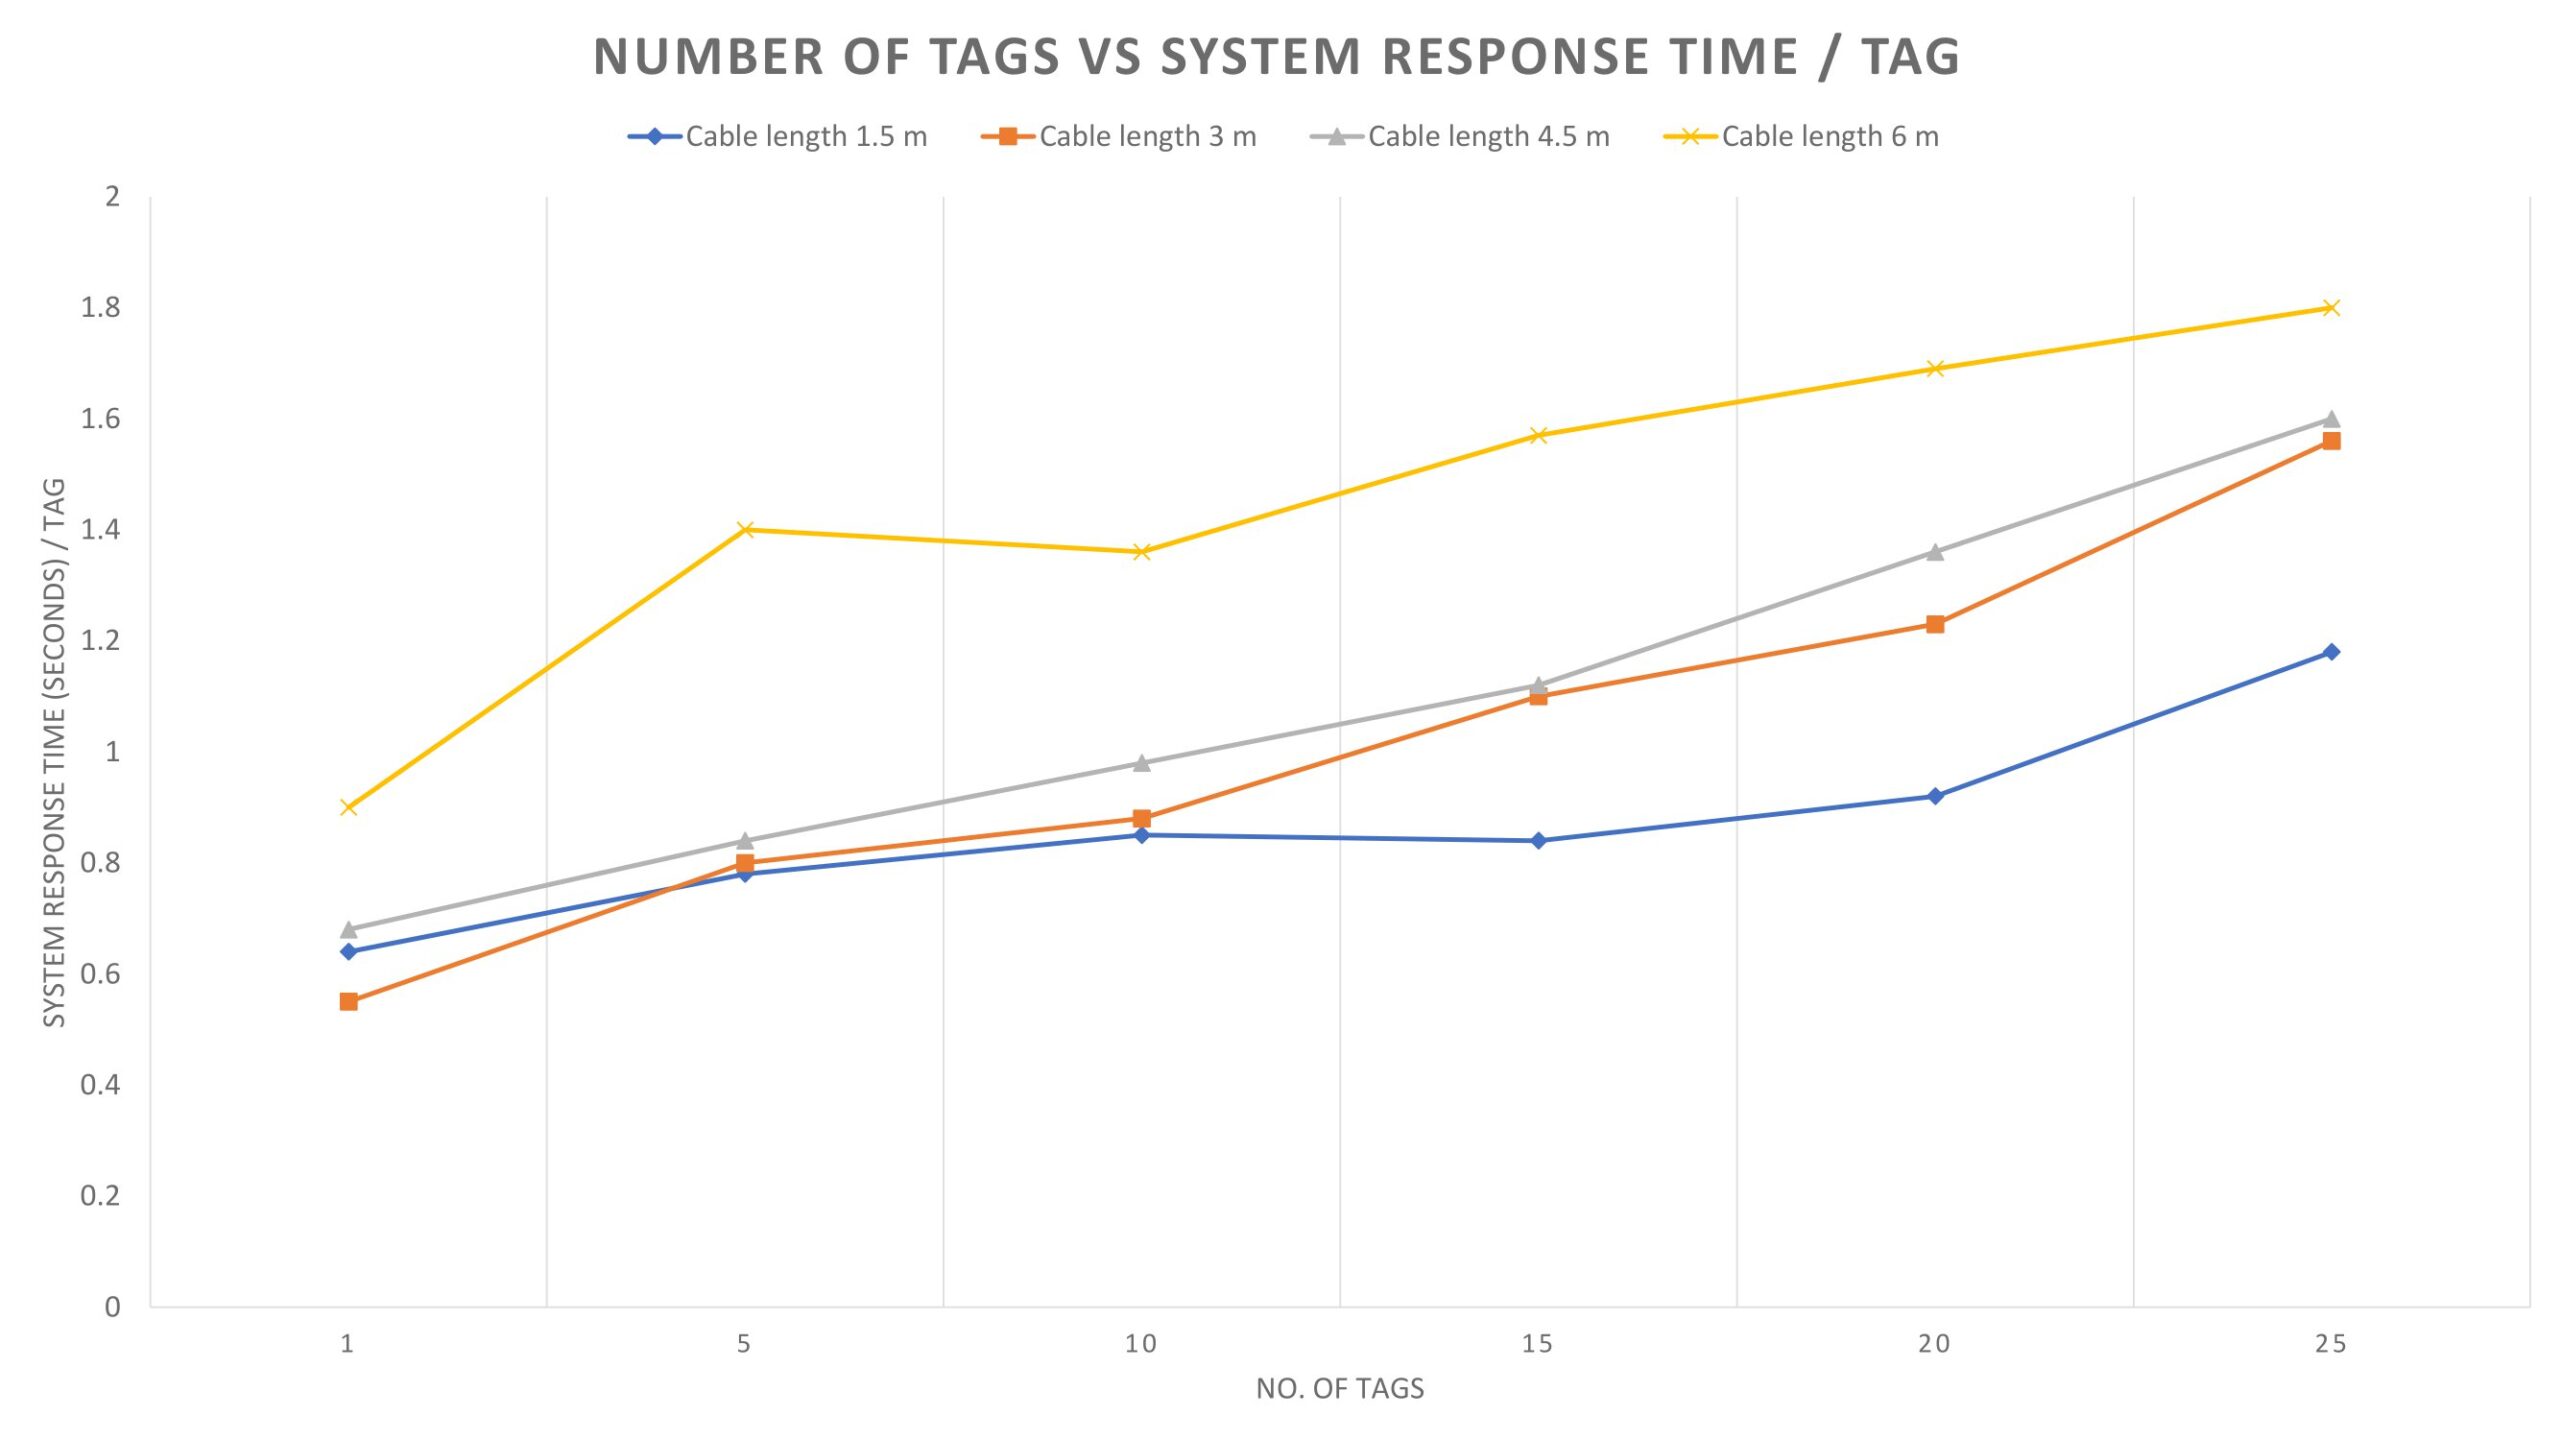
We performed a system response testing for a different number of RFID tags. As the cable length has an impact on serial communication speed we also took the cable length in account for system response time analysis. The response time of our system for these cases are recorded. We used serial communication between the client and the server module at standard 115200 bps baud rate. We used 1.5, 3, 4.5 and 6 meters of serial cable. For each of the cables, we recorded the response time for 1, 5, 10, 15, 20 and 25 tag(s) and calculated the response time per tag. The system response time per tag for different lengths of cable with respect to the number of tags is shown in Fig. 7. Finally, we calculated the average response time per tag for our system. The test result is shown in Table 2. The test result shows that our system has average response time of 0.87, 1.02, 1.1, and 1.45 seconds per tag for 1.5, 3, 4.5, and 6 meters of cable length. Hence, the response time of the overall system is calculated 1.11 second by finding the mean of the average response times per tag.
Figure 7: The system response time (seconds) per tag for different lengths of cable with respect to the number of tags