This project exists entirely outside my professional work — and that's intentional. Personal projects give me a space to practice design decisions I don't always control at work: what chart types to use, how to layer information, how much to show upfront versus hide behind a filter.
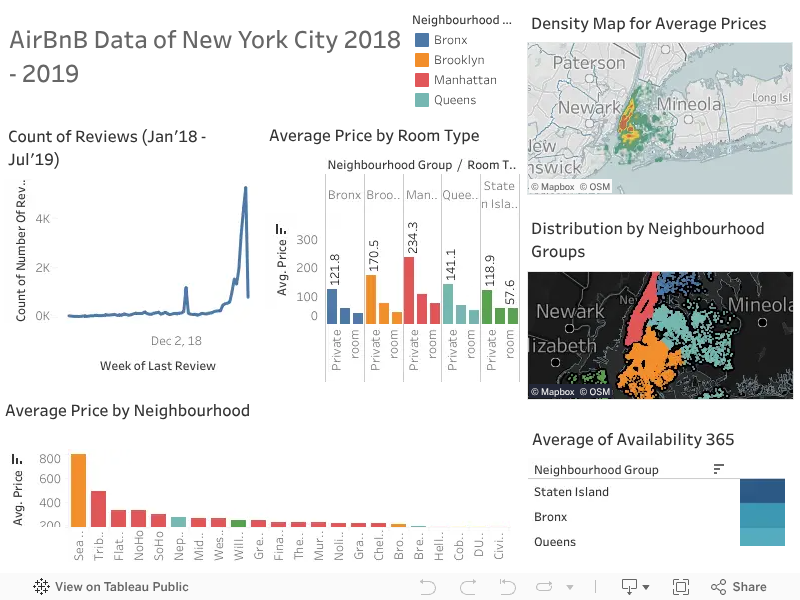
I chose the AirBnB NYC dataset because it's rich, realistic, and multi-dimensional — geography, room type, price, availability, host behavior, and review frequency all create genuine analytical tension without needing to manufacture complexity.
The process involved shaping and cleaning data in Tableau Prep, then rebuilding the dashboard layout through several iterations. I paid close attention to how filters cascade across sheets, how to use color to encode meaning rather than decoration, and how to keep the top-level view scannable while preserving access to detail.
The goal was never a polished deliverable — it was deliberate, honest practice. Every version of this dashboard taught something the previous one didn't.
- 01 LOD Expressions — Used FIXED and INCLUDE calculations to control aggregation independently of the view level, enabling host-level metrics inside listing-level views.
- 02 Cross-filter interactivity — Configured dashboard actions so selecting a borough or room type propagates context across every sheet simultaneously.
- 03 Geographic mapping — Plotted listing density and median price per neighbourhood using Tableau's geocoding plus manual lat/long fields for precision.
- 04 Color as a data channel — Chose diverging vs. sequential palettes deliberately: diverging for price deviation from median, sequential for availability rate.
- 05 Layout composition — Rebuilt the dashboard layout twice to improve visual hierarchy, reduce eye travel, and surface KPIs above the fold.
| Viz | Tableau Desktop, Tableau Public |
| Prep | Tableau Prep Builder |
| Dataset | Inside AirBnB — NYC open listings data |
| Charts | Maps, bar, scatter, treemap, KPI tiles |
| Techniques | LOD expressions, dashboard actions, calculated fields, parameter controls |
See more of my work
Back to the portfolio for research, ML, and industry projects.