This is a personal project with no professional obligation attached — built entirely to practice multi-tab dashboard design and the discipline of turning a large, government-published dataset into a coherent, navigable story.
NY State crime data is publicly available, well-structured, and spans multiple years and counties — making it ideal for practicing trend analysis, geographic comparison, and hierarchical drill-down without inventing complexity. The Table of Contents approach was a deliberate design choice: rather than cramming everything onto one canvas, I wanted to practise scoping each view to a single question.
The dashboard went through several structural iterations. The hardest decisions were about navigation — how to move a non-technical user between tabs without losing context, and how to keep summary KPIs visible across views so the reader always knows where they are in the dataset.
Building a table-of-contents landing page was new territory for me in Tableau. It forced me to think about the dashboard as a document, not just a set of charts — with a clear entry point, logical flow, and an intentional reading order.
- 01 Multi-tab dashboard architecture — Designed a Table of Contents landing page as the entry point, with each subsequent tab scoped to a single analytical question, creating a logical reading order across the workbook.
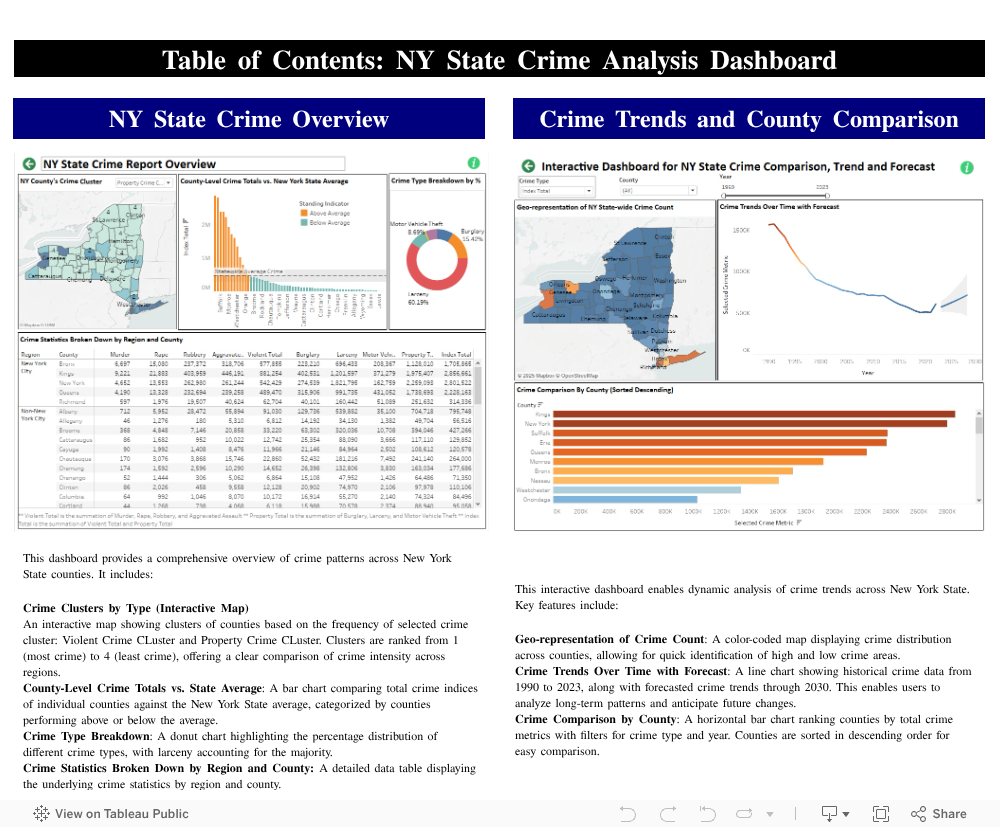
- 02 Geographic analysis — Mapped crime rates and offense counts at the county level using Tableau's filled map type, practicing how to normalize by population to avoid misleading density bias.
- 03 Trend and time-series views — Built year-over-year comparison charts with reference lines and annotations to surface meaningful changes rather than just plotting raw values.
- 04 Navigation UX in Tableau — Used dashboard button actions to build navigation between tabs that feels intentional, preserving filter context so users don't lose their place mid-exploration.
- 05 Offense category breakdowns — Structured views to allow comparison across violent vs. property crime categories, with consistent color encoding carried across all tabs for immediate recognition.
| Viz | Tableau Desktop, Tableau Public |
| Prep | Tableau Prep Builder |
| Dataset | NY State Division of Criminal Justice Services — Index Crime data |
| Charts | Filled maps, line charts, bar charts, KPI tiles, bullet charts |
| Techniques | Multi-tab navigation, button actions, reference lines, parameter filters, calculated fields |
See more of my work
Back to the portfolio for research, ML, and industry projects.